Most of my customers are using Mule Enterprise Edition which comes with the Mule Management Console (MMC) which is really nice for monitoring of Mule Apps and Flows.
Unfortunately its an Enterprise Feature and there is nothing similar for the Community Edition supported by MuleSoft.
That's why I searched for Open Source Tools and decided to use hawtio for the monitoring of my customers Mule apps and flows.
This post describes how to connect hawtio with a standalone Mule Community Edition runtime by using jolokia for Remote JMS wit JSON over HTTP.
What is Jolokia?
Jolokia is a JMX-HTTP bridge giving an alternative to JSR-160 connectors. It is an agent based approach with support for many platforms. In addition to basic JMX operations it enhances JMX remoting with unique features like bulk requests and fine grained security policies.
Why Jolokia instead of JMX?
I decided to choose Jolokia instead of JMX because it uses http as transport protocol which works more easily over firewalls and proxies.
Adding the Jolokia Agent to Mule
Adding a jolokia agent to Mule is quite simple. First you have to download the jolokia Mule-Agent.
In the next step you have to add it to the lib/opt folder of your standalone Mule runtime.
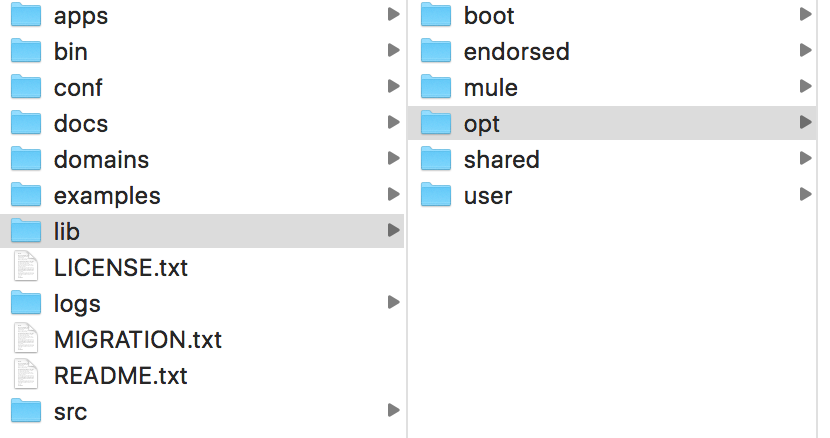
Just put the jolokia-mule-x.x.x-agent.jar in the
lib/opt folder and open the mule-config.xml which is located in the apps/default folder.
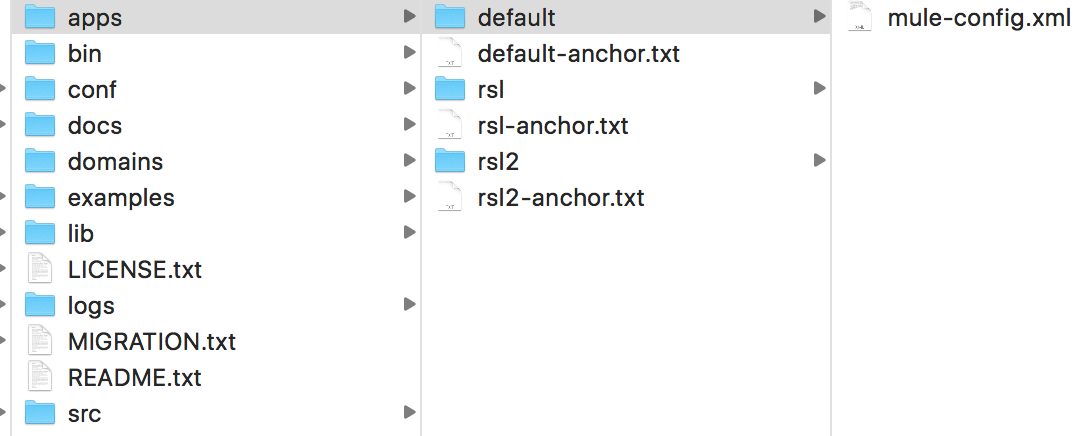
After that you have to add some XML Snippets to the empty
mule-config.xml to add the jolokia Mule agent.
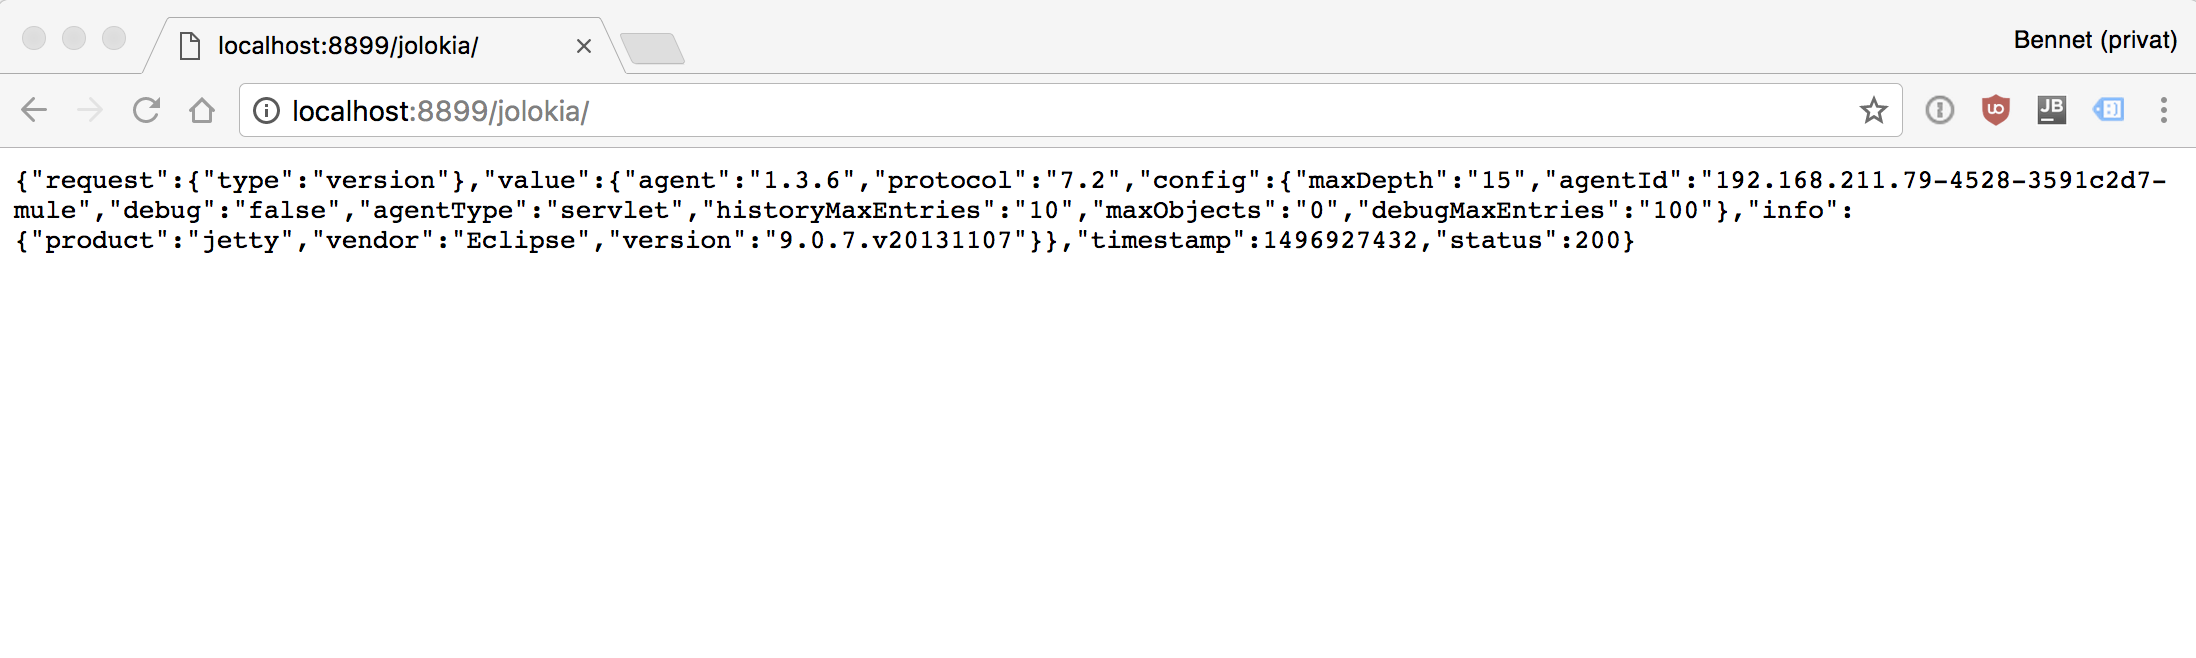
In the last step you have to stop and start the Mule runtime via
./mule stop and ./mule start and test if it works correctly by calling: http://localhost:8899/jolokia in your browser of choice.
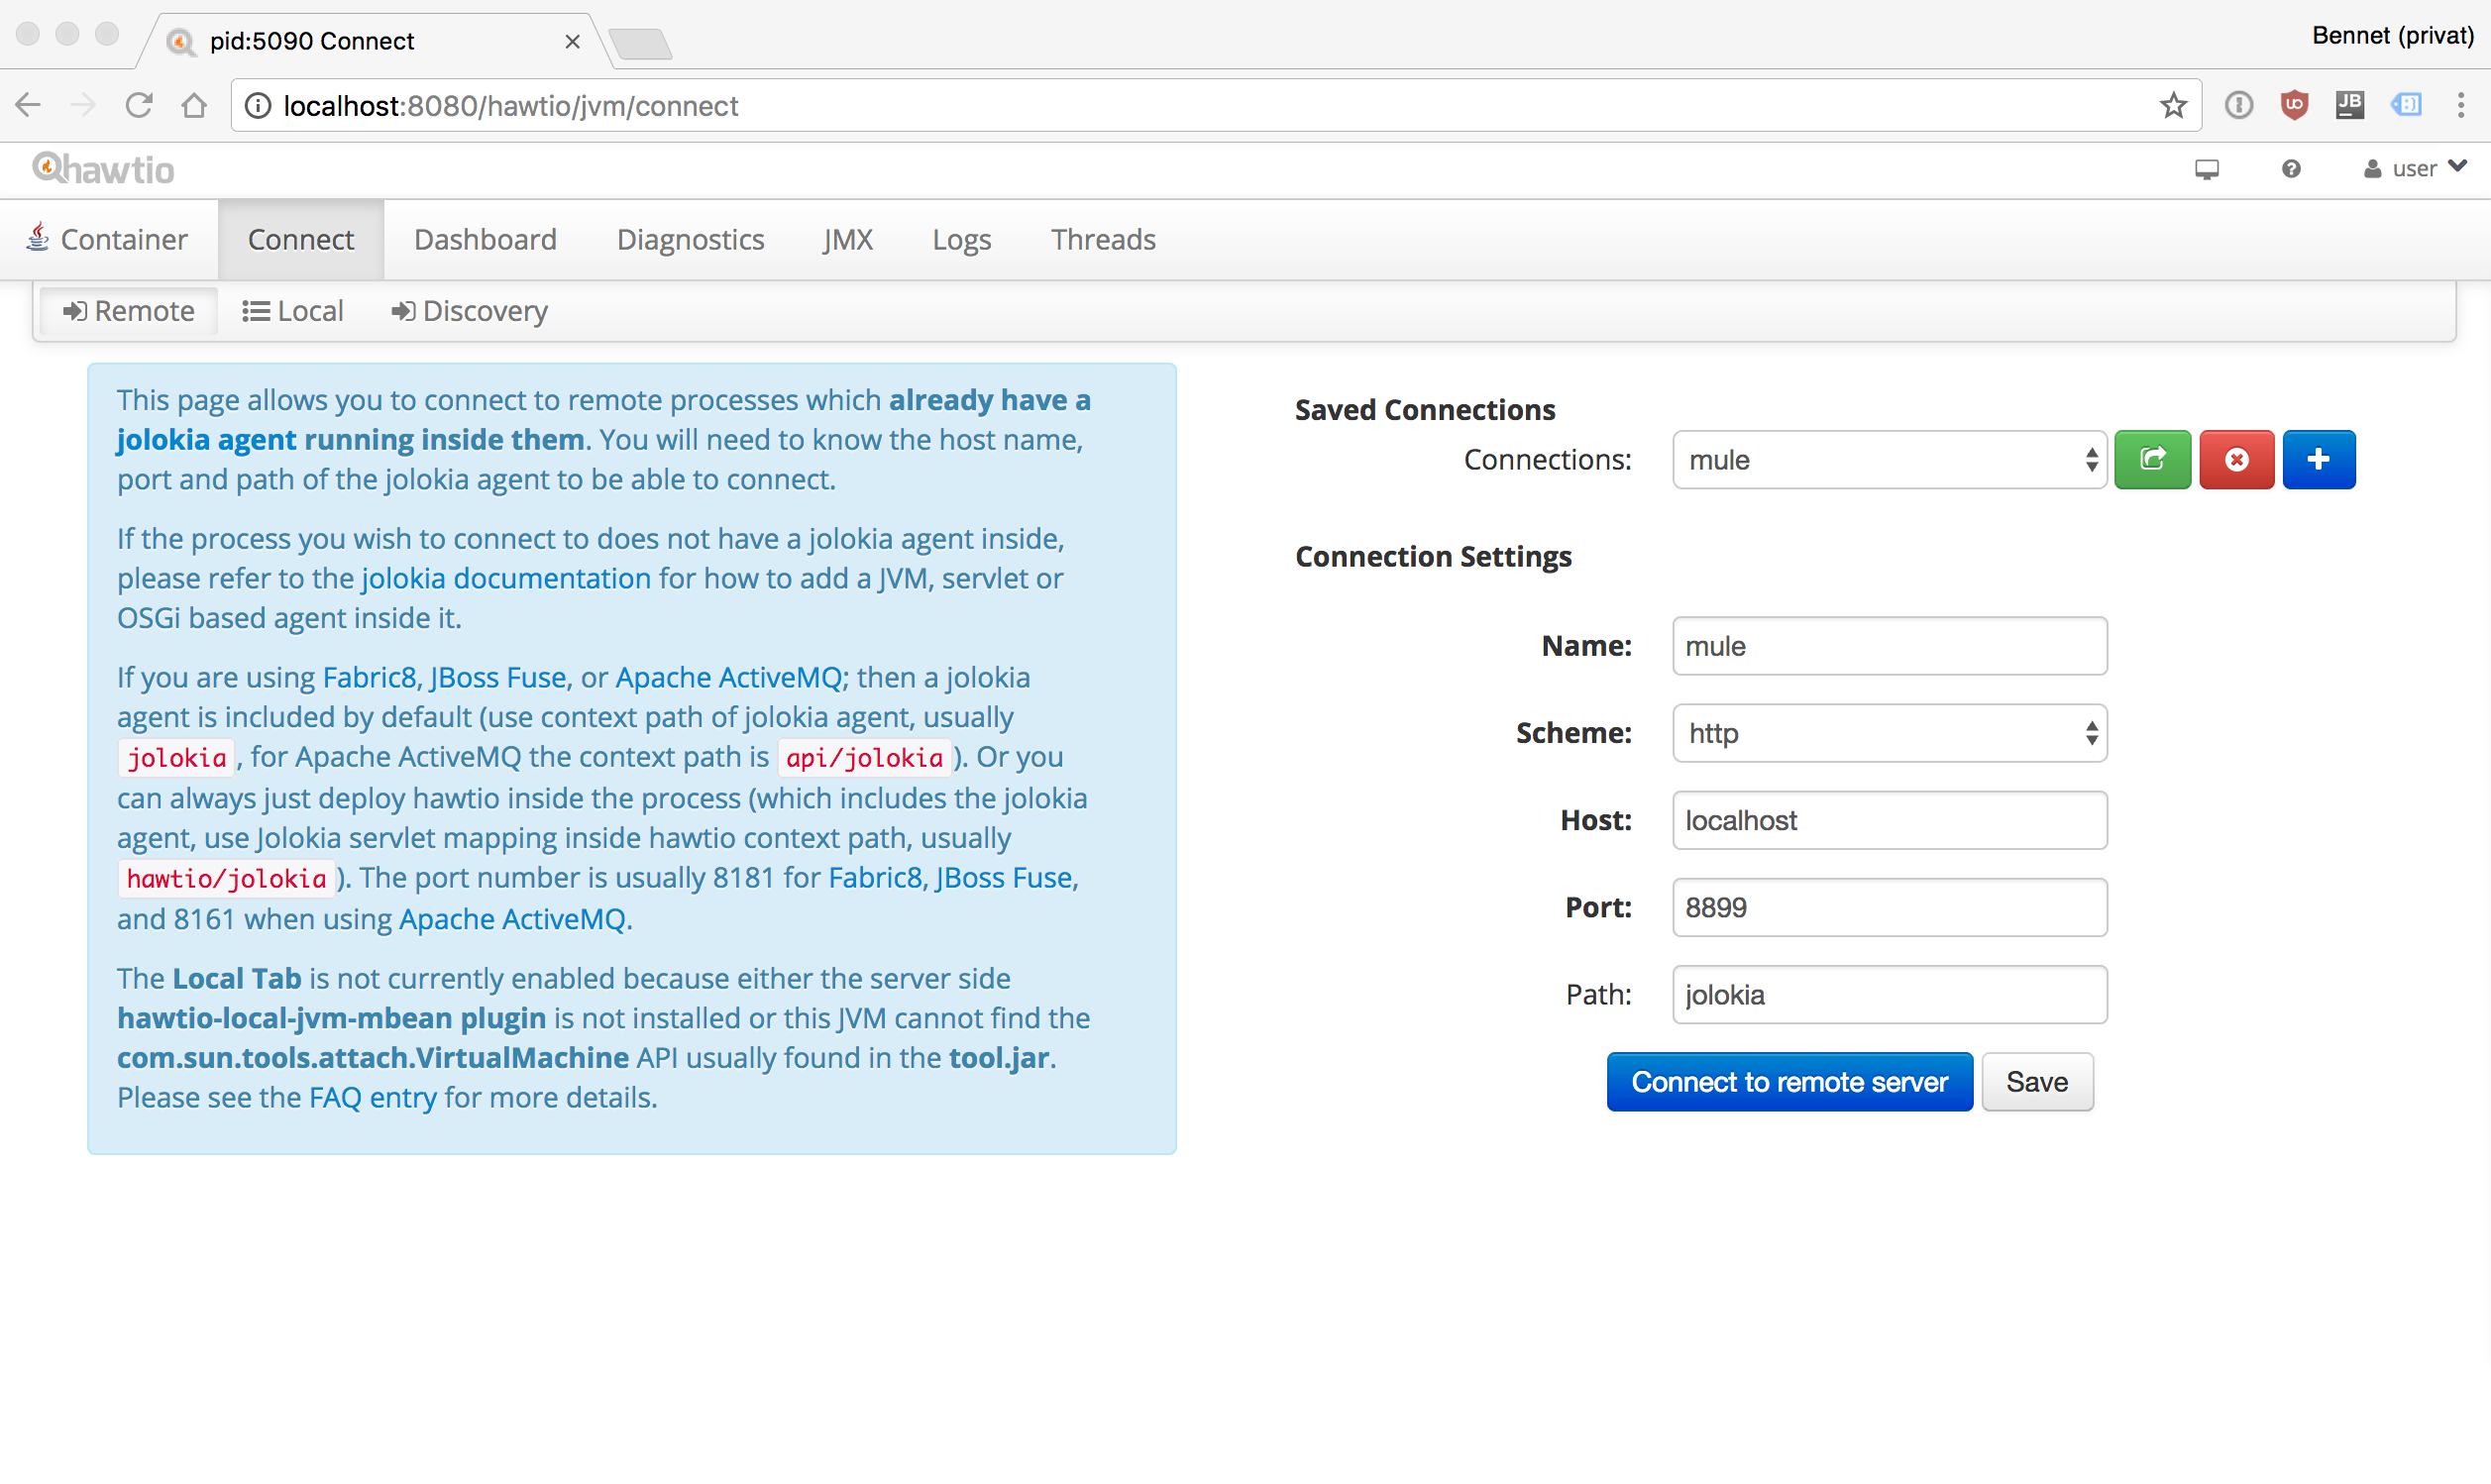
Connecting to Mule using hawtio
After adding the agent to Mule you have to download hawtio and run it via console java -jar hawtio-app-x.x.x.jar.
It takes some seconds until your primary browser opens the entry url http://localhost:8080/hawtio.
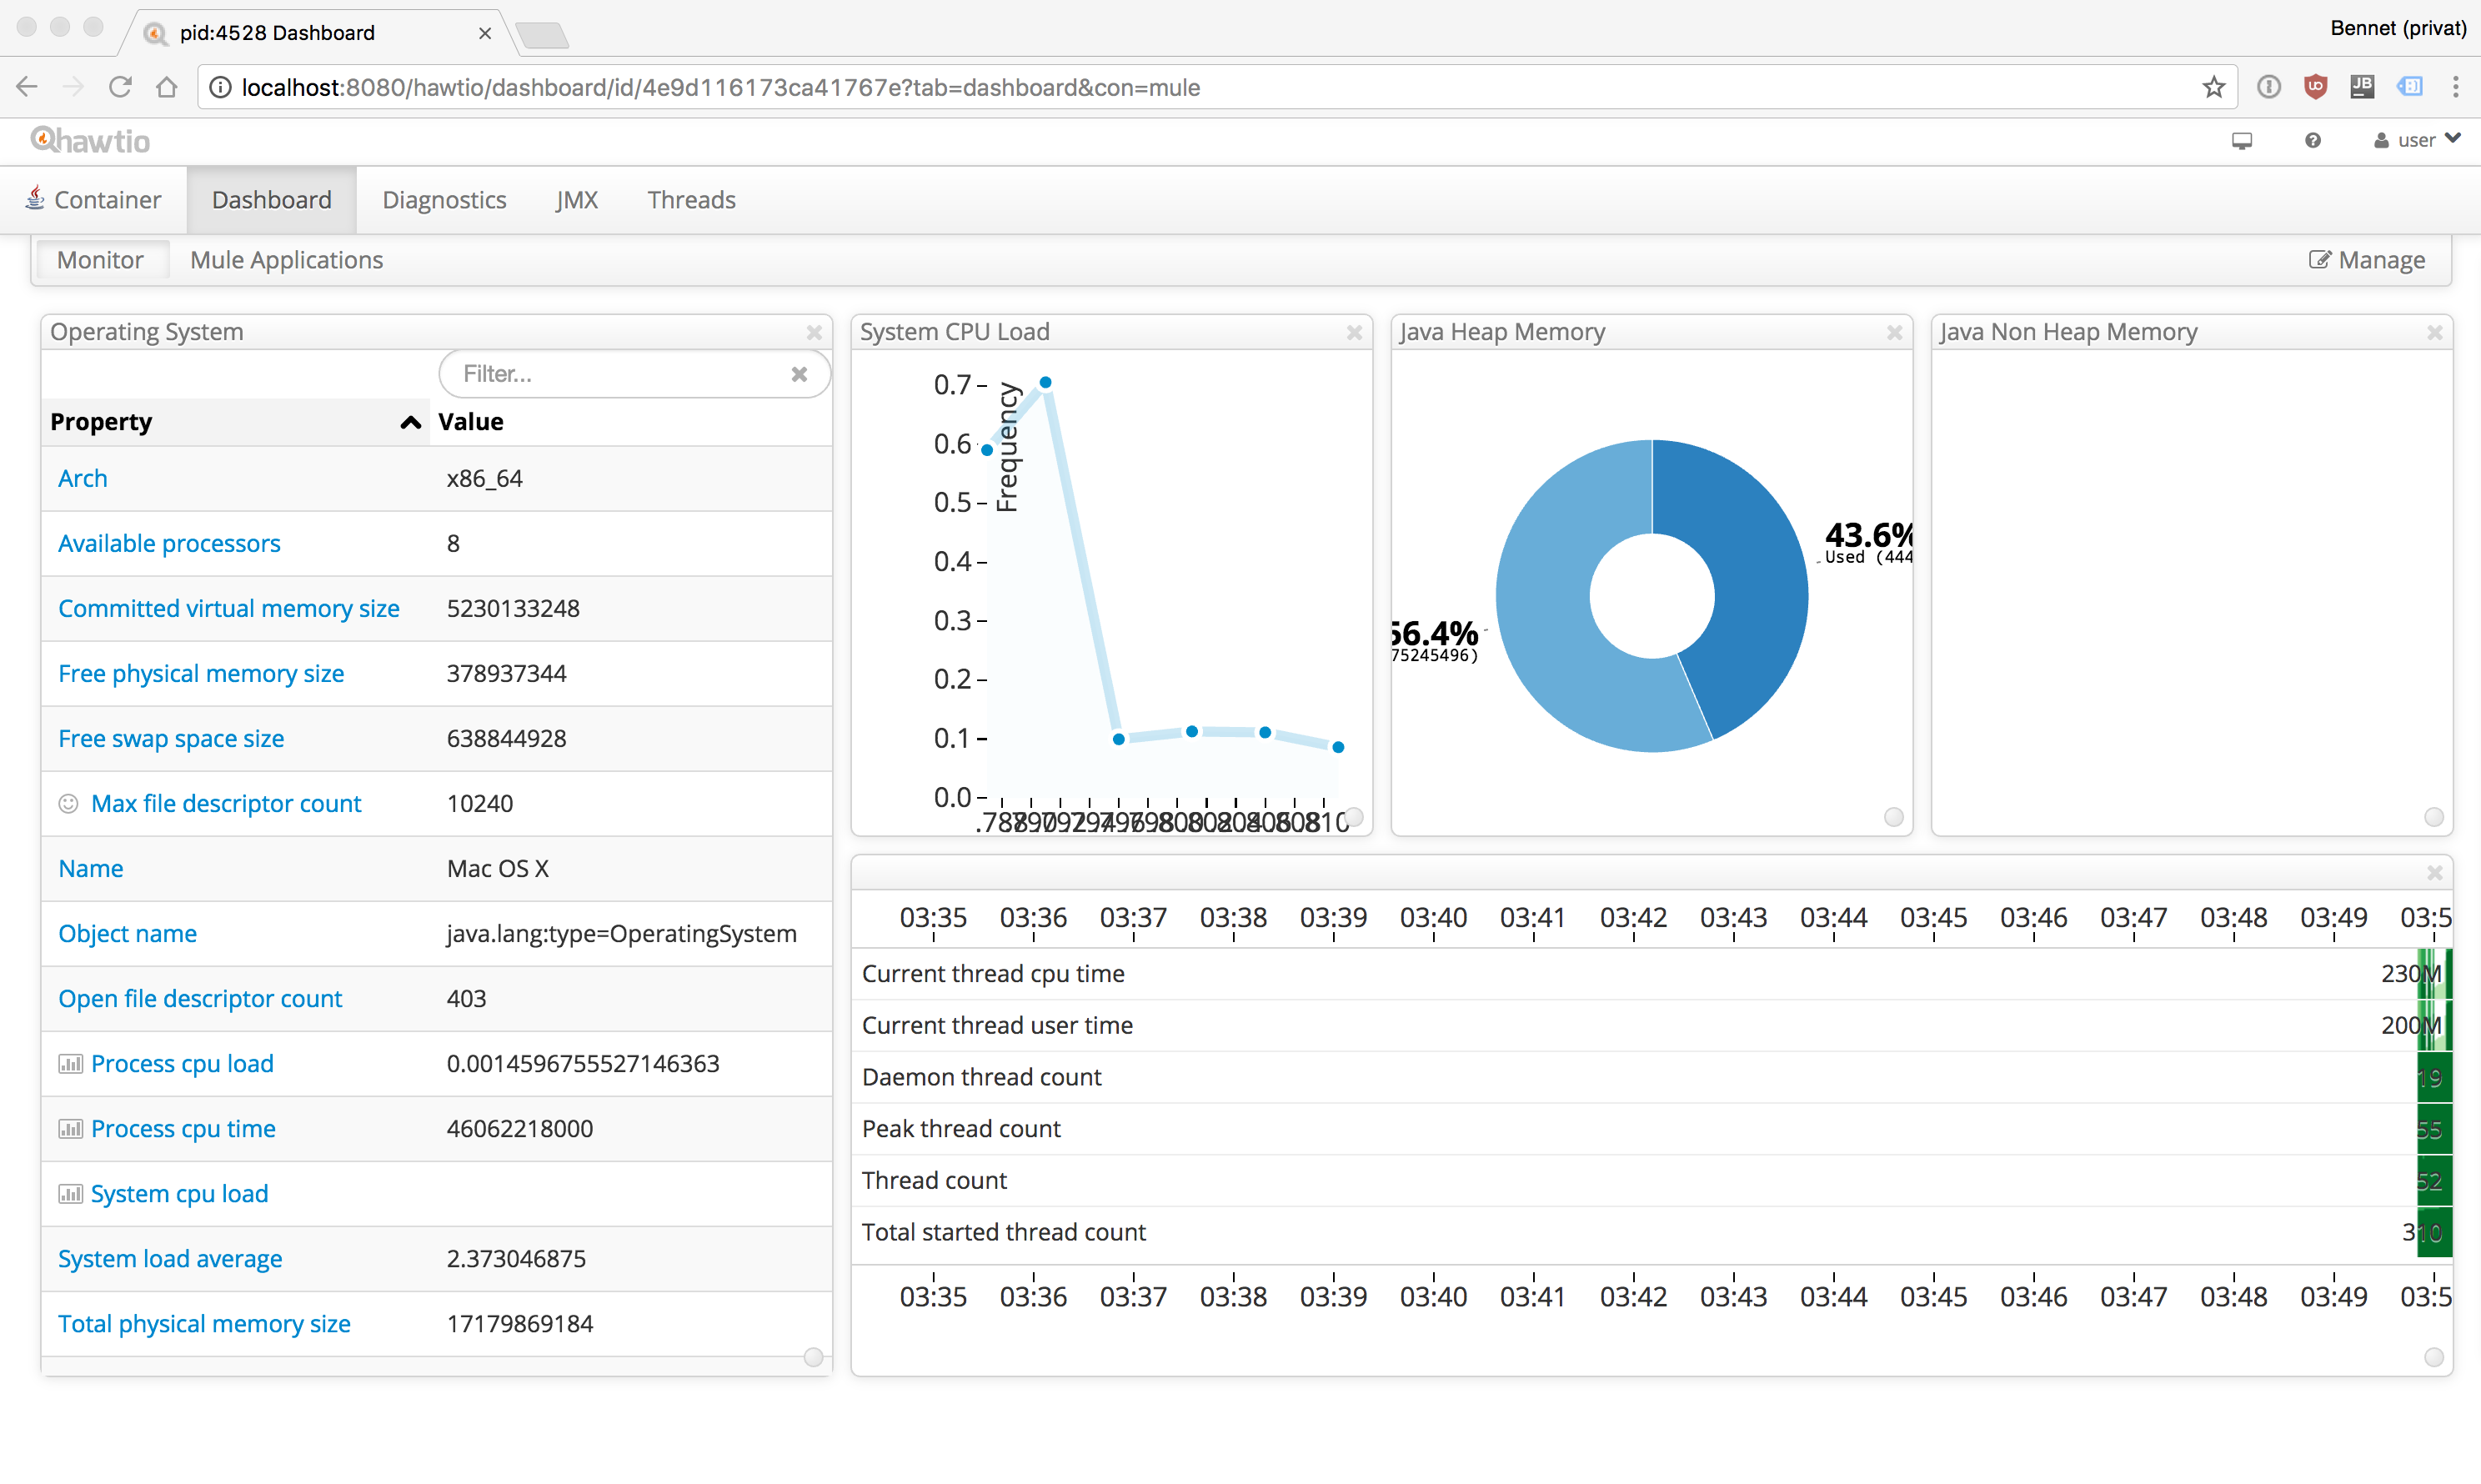
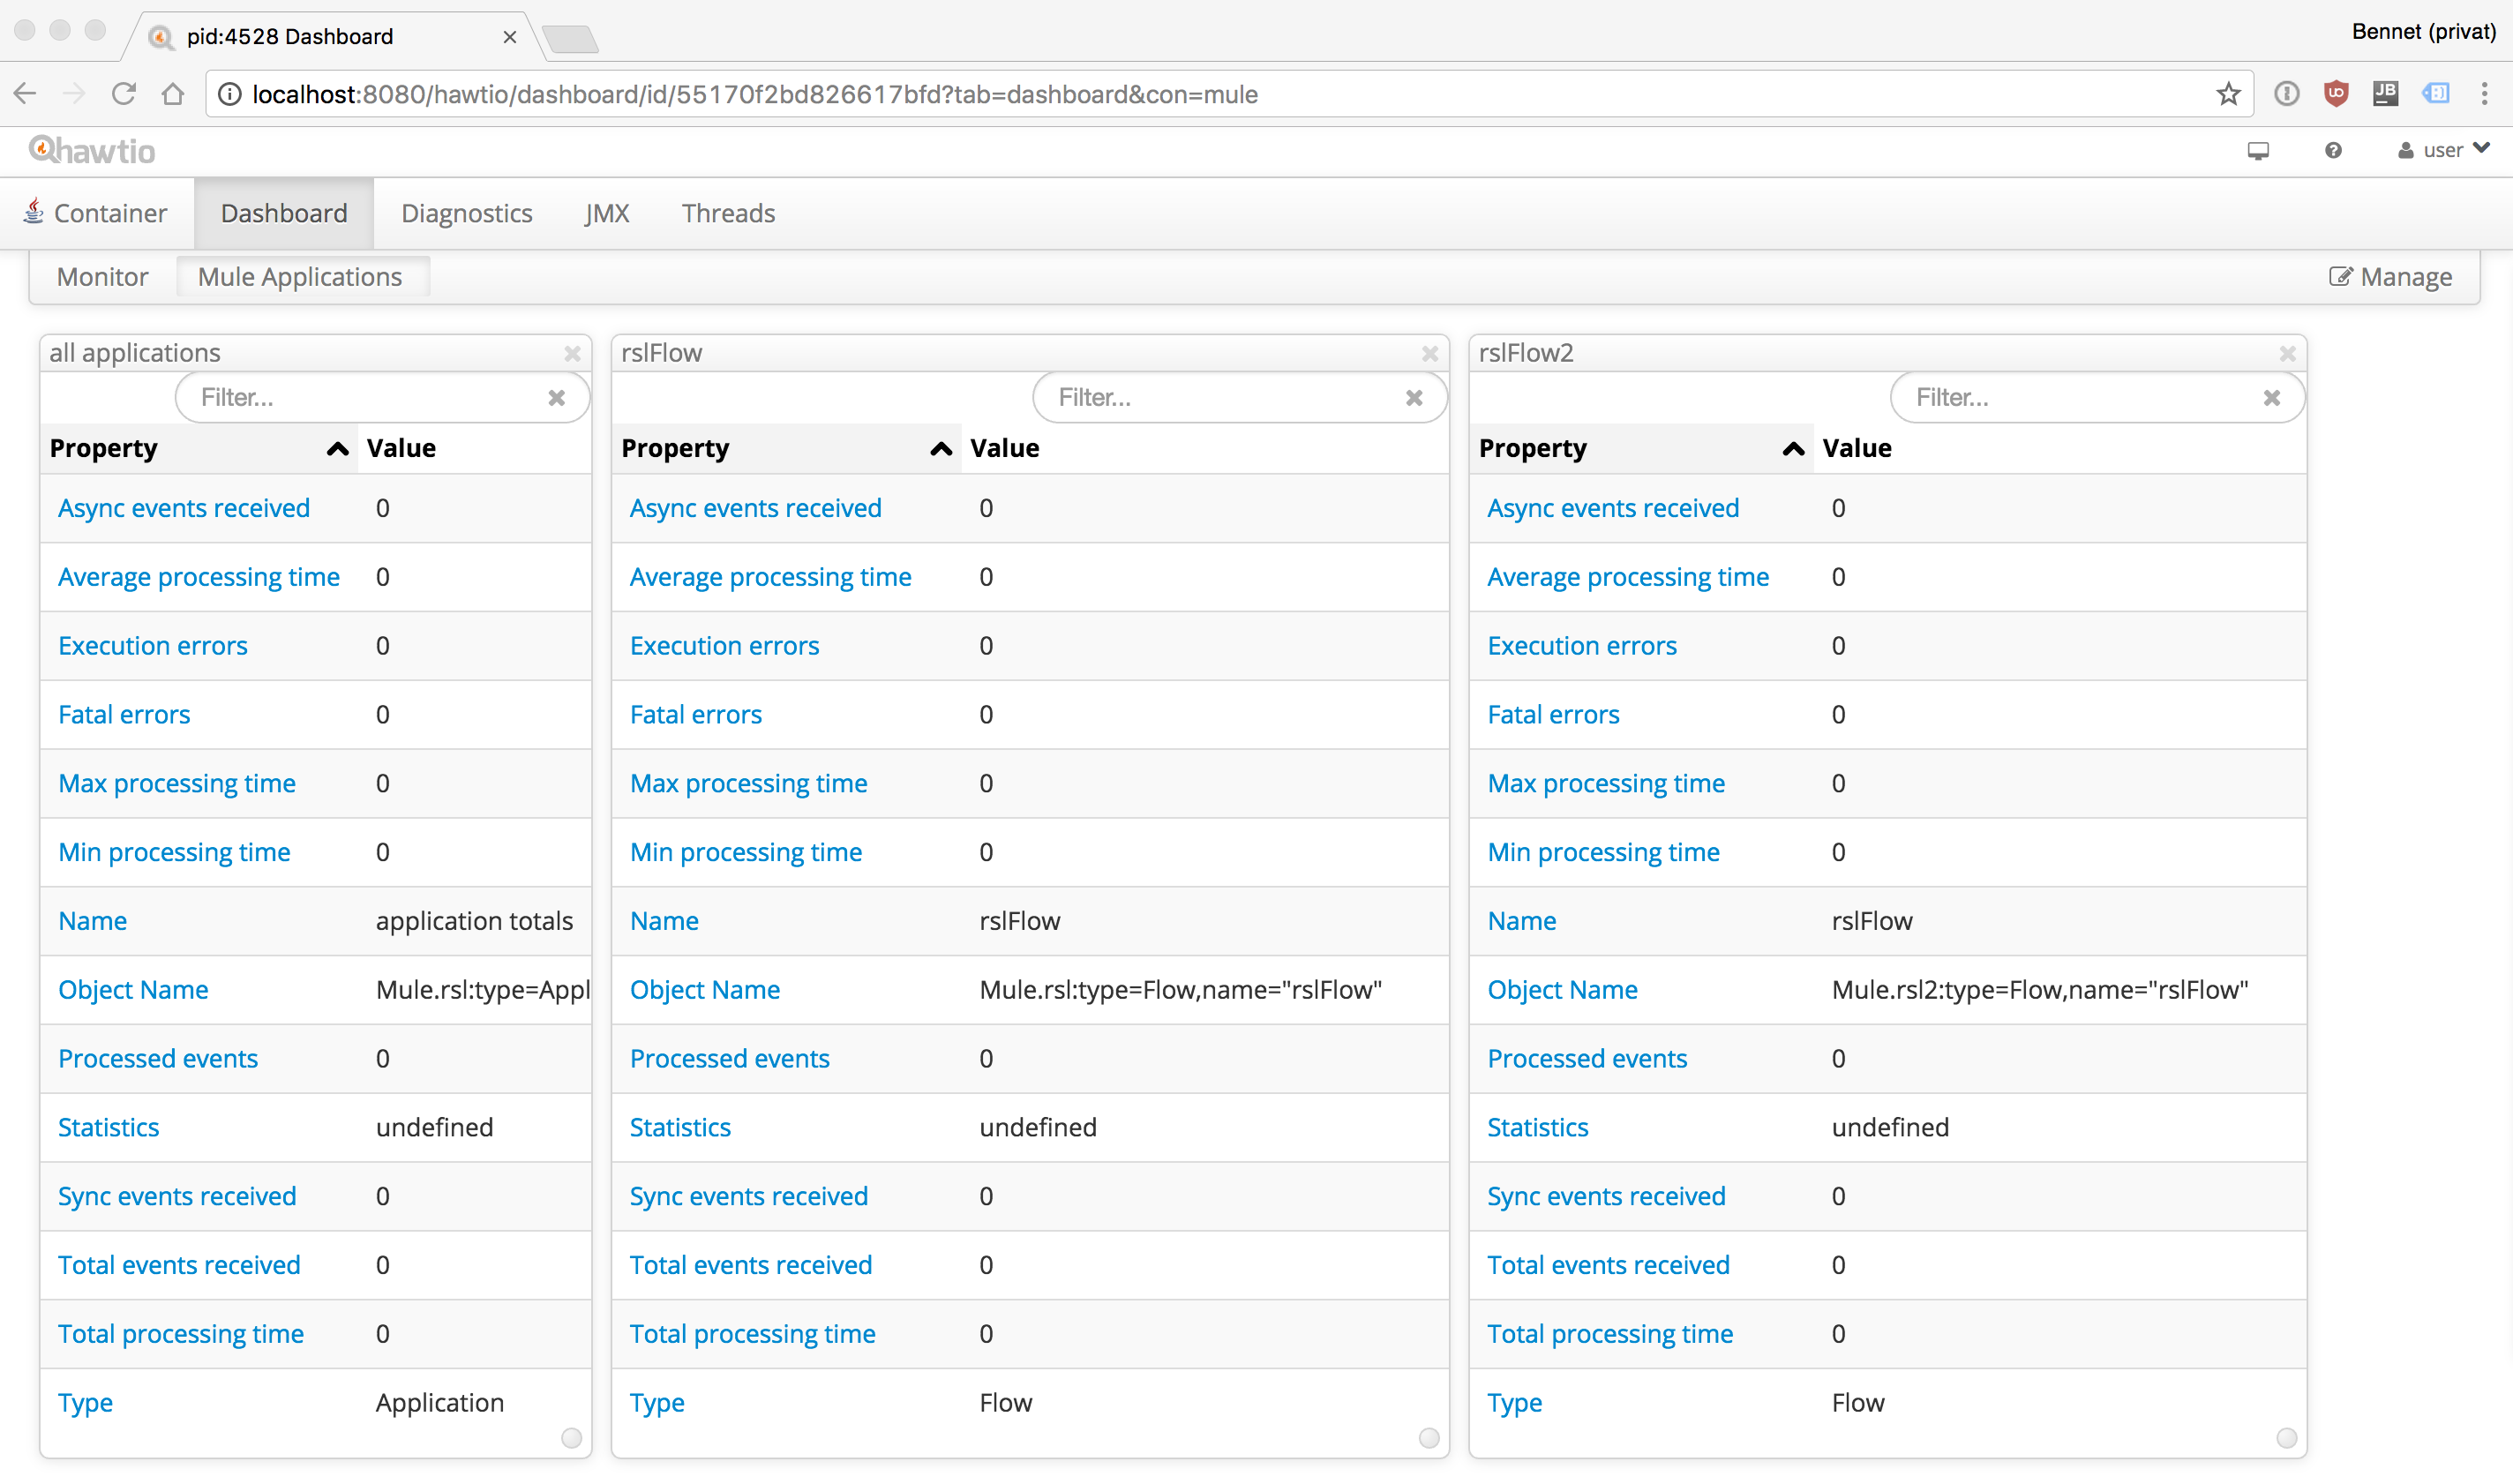
Creating a Mule Dashboard for a Mule project and flow
Beside this JVM Dashboard its also useful to create your own dashboards which show informations about every project and every single flow in detail. Therefore you can create a new custom dashboard which contains JMX informations about your flows. The following image shows such a dashboard with the Mule projects overall statistics and statistics for every single flow.
Bye,
Bennet
Be Social, Share!